|
| since 2014.12.30 |
| last update 2015.05.05 |
|
|
|
|
| TopPage > R言語関係 |
[hoge]# yum install R-* ..... |
[hoge]$ rpm -qa | grep R- R-3.1.2-1.el6.i686 R-core-3.1.2-1.el6.i686 R-multcomp-1.2.17-1.el6.noarch R-devel-3.1.2-1.el6.i686 R-systemfit-1.1.15-4.el6.noarch R-lmtest-0.9.30-1.el6.i686 R-java-devel-3.1.2-1.el6.i686 R-DBI-0.2.5-7.el6.noarch R-qtl-1.33.7-1.el6.i686 R-mvtnorm-0.9.9994-1.el6.i686 R-RODBC-1.3.6-1.el6.i686 R-java-3.1.2-1.el6.i686 OpenEXR-libs-1.6.1-8.1.el6.i686 R-sandwich-2.2.10-1.el6.noarch R-car-2.0.16-1.el6.noarch R-nws-1.7.0.1-7.el6.noarch R-core-devel-3.1.2-1.el6.i686 R-msm-1.1.4-1.el6.1.i686 R-zoo-1.7.9-1.el6.i686 |
[hoge]$ yum info R-*
利用可能なパッケージ
名前                : R
アーキテクチャ      : i686
バージョン          : 3.1.2
リリース            : 1.el6
容量                : 0.0
リポジトリー        : installed
提供元リポジトリー  : epel
要約                : A language for data analysis and graphics
URL                 : http://www.r-project.org
ライセンス          : GPLv2+
説明                : This is a metapackage that provides both core R userspace
                    : and all R development components.
                    :
                    : R is a language and environment for statistical computing
                    : and graphics. R is similar to the award-winning S system,
                    : which was developed at Bell Laboratories by John Chambers
                    : et al. It provides a wide variety of statistical and
                    : graphical techniques (linear and nonlinear modelling,
                    : statistical tests, time series analysis, classification,
                    : clustering, ...).
                    :
                    : R is designed as a true computer language with
                    : control-flow constructions for iteration and alternation,
                    : and it allows users to add additional functionality by
                    : defining new functions. For computationally intensive
                    : tasks, C, C++ and Fortran code can be linked and called at
                    : run time.

名前                : R-DBI
アーキテクチャ      : noarch
バージョン          : 0.2.5
リリース            : 7.el6
容量                : 558 k
リポジトリー        : installed
.........
|
[hoge]$ R R version 3.1.2 (2014-10-31) -- "Pumpkin Helmet" Copyright (C) 2014 The R Foundation for Statistical Computing Platform: i686-redhat-linux-gnu (32-bit) R は、自由なソフトウェアであり、「完全に無保証」です。 一定の条件に従えば、自由にこれを再配布することができます。 配布条件の詳細に関しては、'license()' あるいは 'licence()' と入力してください。 R は多くの貢献者による共同プロジェクトです。 詳しくは 'contributors()' と入力してください。 また、R や R のパッケージを出版物で引用する際の形式については 'citation()' と入力してください。 'demo()' と入力すればデモをみることができます。 'help()' とすればオンラインヘルプが出ます。 'help.start()' で HTML ブラウザによるヘルプがみられます。 'q()' と入力すれば R を終了します。 > |
> getwd() [1] "/hoge/moge/age" > |
> setwd("/hogeage/work/temp")
>
|
[temp_p]$ ls temp_c xxx.txt yyy.cvs zzz.R [temp_p]$ cd temp_c [temp_c]$ ls aaa.txt abvdef.R dcba.csv |
> getwd()
[1] "xxxxxxxxxxxxx/temp_p/temp_c"
>
> list.files()
[1] "aaa.txt"  "abvdef.R" "dcba.csv"
>
> list.files("./")
[1] "aaa.txt"  "abvdef.R" "dcba.csv"
>
> list.files("../")
[1] "temp_c"  "xxx.txt" "yyy.cvs" "zzz.R"
>
> dir()
[1] "aaa.txt"  "abvdef.R" "dcba.csv"
>
> dir("./")
[1] "aaa.txt"  "abvdef.R" "dcba.csv"
>
> dir("../")
[1] "temp_c"  "xxx.txt" "yyy.cvs" "zzz.R"
>
> list.dirs()
[1] "."
>
> list.dirs("./")
[1] "./"
>
> list.dirs("../")
[1] "../"        "..//temp_c"
>
|
3 5 10 5 6 77 4 5 22 34 43 65 76 67 44 |
> aab <- scan("./aaa.txt")
Read 15 items
> aab    #確認
 [1]  3  5 10  5  6 77  4  5 22 34 43 65 76 67 44
>
|
a, b, c, d 10, 20, 30, 40 2, 3, 4, 5 12, 23, 34, 45 678,789,890,901 98, 87, 76, 65 |
> csv_dt <- read.csv("./dcba.csv")
> csv_dt    #確認
    a   b   c   d
1  10  20  30  40
2   2   3   4   5
3  12  23  34  45
4 678 789 890 901
5  98  87  76  65
|
> csv_dt <- read.table("./dcba.csv", header=TRUE, sep=",")
> csv_dt    #確認
    a   b   c   d
1  10  20  30  40
2   2   3   4   5
3  12  23  34  45
4 678 789 890 901
5  98  87  76  65
|
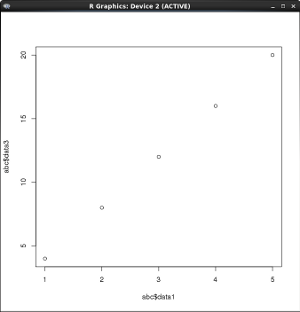
data1, data2, data3 1,2,4 2,4,8 3,6,12 4,8,16 5,10,20 |
abc <- read.csv("./abcabc.csv")
plot(abc$data1, abc$data3)
|
> source("./abcdef.R")
|
> colors() # もしくは、colours() [1] "white" "aliceblue" "antiquewhite" [4] "antiquewhite1" "antiquewhite2" "antiquewhite3" [7] "antiquewhite4" "aquamarine" "aquamarine1" [10] "aquamarine2" "aquamarine3" "aquamarine4" .... [652] "yellow" "yellow1" "yellow2" [655] "yellow3" "yellow4" "yellowgreen" > |
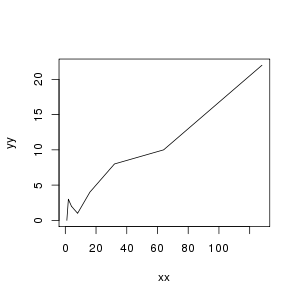
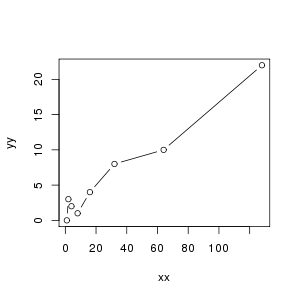
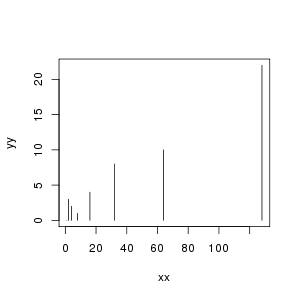
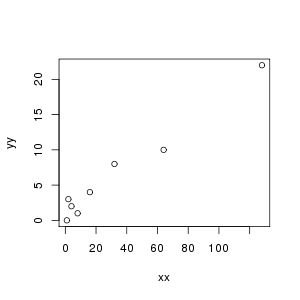
> xx <-c(1,2,4,8,16,32,64,128) > yy <-c(0,3,2,1,4,8,10,22) |
> png("./plot_sample00.png", width=300, height=300)  # pngファイルにして保存する指示を先に設定しておく
> plot(xx,yy)
> dev.off()    # graphic deviceを閉じて出力されたpngファイルをクローズする。
|
|
|||||||||
|
|||||||||
|
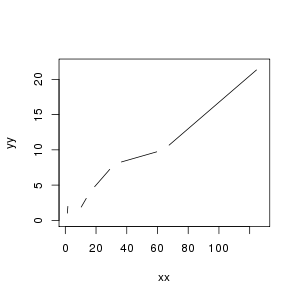
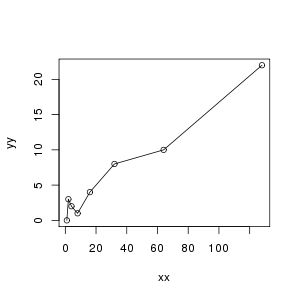
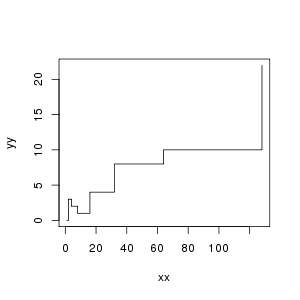
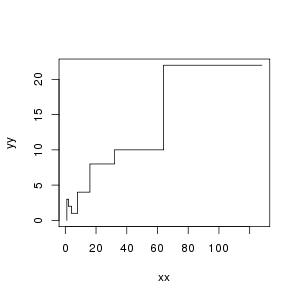
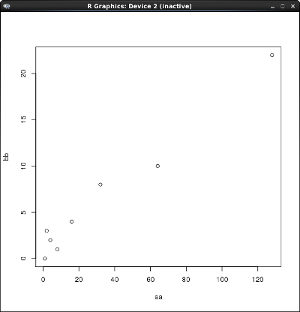
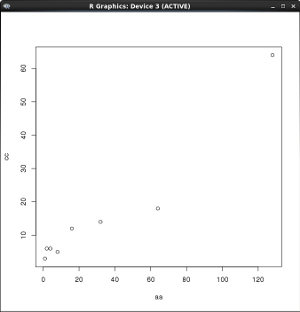
> aa <-c(1,2,4,8,16,32,64,128) > bb <-c(0,3,2,1,4,8,10,22) > cc <-c(3,6,6,5,12,14,18,64) |
> plot(aa,bb) ## 1つplotしてみる ---> Fig.1 > dev.new() ## 新しいデバイス(何も表示されていないwindow)が開く ---> Fig.2 > plot(aa,cc) ## 2つplotで2つ目のwindowに結果が表示される ---> Fig.3 > dev.off() ## 2つ目のwindowを閉じる > dev.off() ## 1つ目のwindowを閉じる |
|

|
|
| Fig.1 | Fig.2 | Fig.3 |
| TopPage > R言語関係 |