
|
| since 2007.10.24 |
| last update 2011.01.08 |
|
|
|
|
| TopPage > gnuplot関係 > gnuplot関係[02] |
| データファイルを読み込んでのプロット |
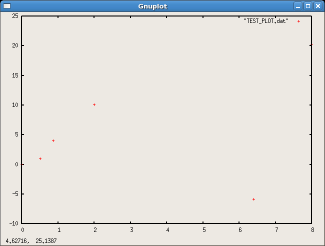
# TEST_PLOT.dat ←#以降は、コメント行 # x y 0.0 0.0 0.5 1 ←数値は、浮動小数点でも整数でもいい 0.86 4.0 2 10.1 6.4 -5.876 8 20.2 |
gnuplot> plot "TEST_PLOT.dat" |
|
|
gnuplot |
|
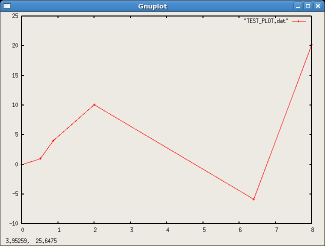
gnuplot> plot "TEST_PLOT.dat" with lines |

|
|
gnuplot |
|
gnuplot> plot "TEST_PLOT.dat" with linespoints |
| コマンドライン内で入力したデータをプロット |
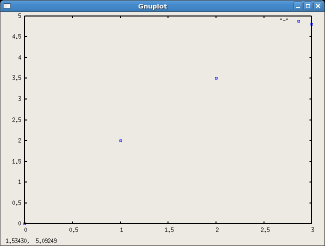
gnuplot> plot "-" with point 3 4  ここで3は、線の色  4は、pointの形状
input data ('e' ends) > 0 0
input data ('e' ends) > 1 2
input data ('e' ends) > 2 3.5
input data ('e' ends) > 3 4.8
input data ('e' ends) > e
|
|
|
gnuplot |
|
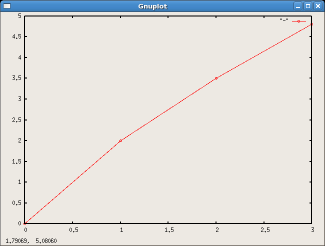
gnuplot> plot "-" with linespoints 9 6
input data ('e' ends) > 0 0
input data ('e' ends) > 1 2
input data ('e' ends) > 2 3.5
input data ('e' ends) > 3 4.8
input data ('e' ends) > e
|
|
|
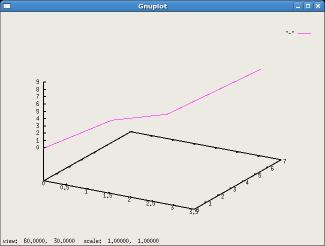
gnuplot> splot "-" with lines 28
input data ('e' ends) > 0 0 0
input data ('e' ends) > 1 2 3
input data ('e' ends) > 2 3 4
input data ('e' ends) > 3.2 6.4 8.2
input data ('e' ends) > e
|
|
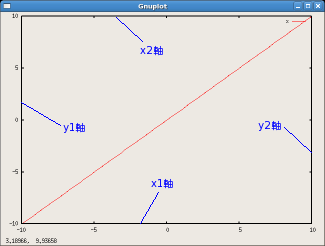
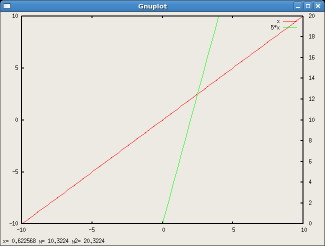
| 対応する軸を指定した式のプロット |
|
|
gnuplot |
|
gnuplot> set ytics nomirror ←y2軸にy1軸からの目盛り表示を消す gnuplot> set y2tics 0,2,20 ←y2軸に目盛りを付ける。この例は、0から20まで2stepで表示 gnuplot> set y2range [0:20] ←y2軸の表示範囲を設定 gnuplot> plot x axis x1y1,5*x axis x1y2 ←axisで対応する軸を指定 |
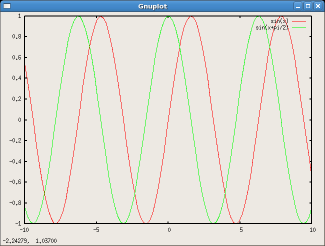
| 複数の式のプロット |
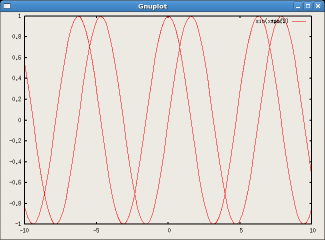
gnuplot> plot sin(x),sin(x+pi/2) |
|
|
gnuplot |
|
gnuplot> set multiplot multiplot> plot sin(x) multiplot> plot sin(x+pi/2) |
|
|
gnuplot |
|
multiplot> unset multiplot gnuplot> |
| TopPage > gnuplot関係 > gnuplot関係[02] |