|
| since 2007.10.24 |
| last update 2011.02.13 |
|
|
| TopPage > gnuplot関係 > gnuplot関係[03] |
| 軸の範囲指定 |
gnuplot> plot [-2:12] [-16:30] "TEST_PLOT.dat" with linespoints |
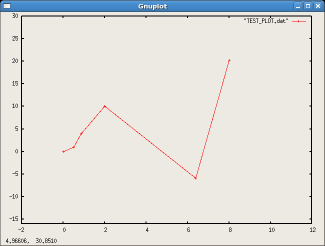
gnuplot> plot "TEST_PLOT.dat" with linespoints gnuplot> set xrange [-2:12] gnuplot> set yrange [-16:30] gnuplot> replot |
gnuplot> set autoscale ←全ての軸を自動設定に戻す gnuplot> set autoscale x ←x軸だけを自動設定に戻す gnuplot> set autoscale y ←y軸だけを自動設定に戻す |
| 軸の目盛り |
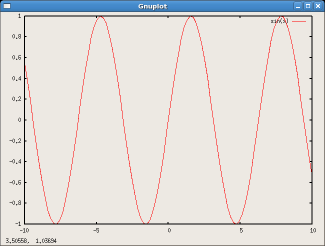
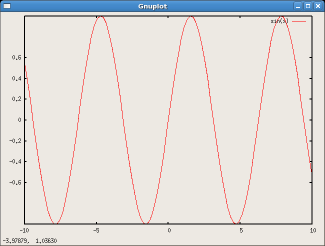
| デフォルト | 変更後 |
| plot sin(x) |
set ytics -0.6,0.2,0.6 replot |
|
|
|
|
gnuplot |
|
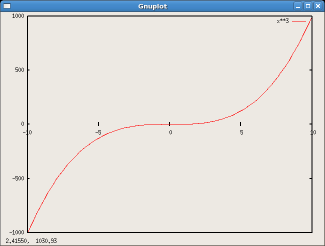
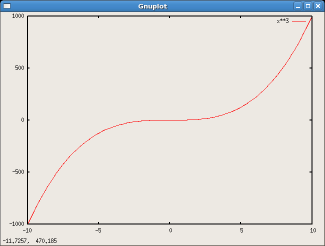
| 原点位置に表示 | 境界位置に表示 |
| set xtics axis | set xtics border |
|
|
|
|
gnuplot |
|
|
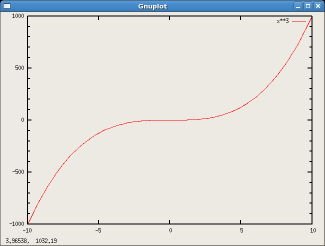
y軸に小目盛りを5刻で表示。 目盛りの長さを2、 小目盛りの長さを1.2にする。 |
y軸に小目盛りを表示しない 目盛りの長さをデフォルト (目盛り:1.0、小目盛り:0.5)に戻す。 |
|
set mytics 5 set ticscale 2 1.2 |
unset mytics unset ticscale |
|

|
|
|
gnuplot |
|
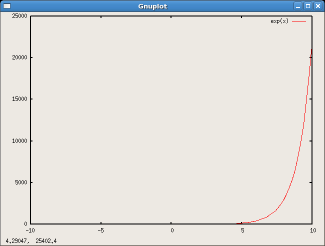
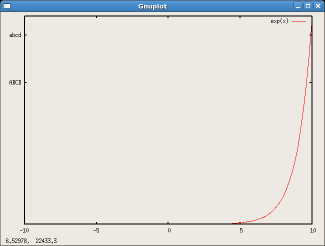
| 通常の表示。 | 目盛りを文字列に変更 |
| plot exp(x) |
set ytics ("abcd" 20000, "ABCD" 15000) replot |
|
|
|
|
gnuplot |
|
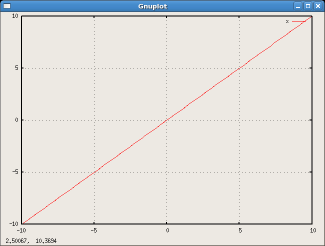
| 軸の補助線(グリッド) |
gnuplot> set grid gnuplot> plot x |
|
|
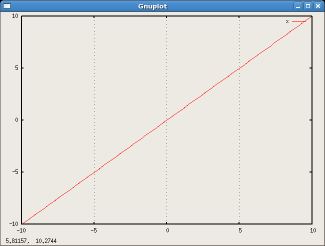
gnuplot> set grid xtics gnuplot> plot x |
|
|
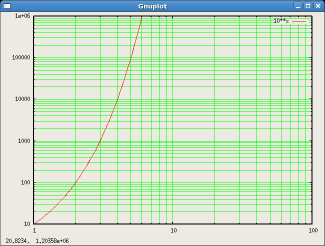
gnuplot> set logscale xy 10 gnuplot> set xrange [1:100] gnuplot> set yrange [10:1000000] gnuplot> set mytics 10 gnuplot> set grid lt 2 gnuplot> set grid mxtics lt 2 gnuplot> set grid mytics lt 2 gnuplot> plot 10**x |
|
|
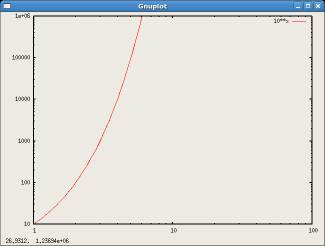
※上のグラフを表示後 gnuplot> unset grid gnuplot> replot |
|
| (3D)3次元グラフのプロット |
gnuplot> splot sin(x/pi)*sin(y/pi) |
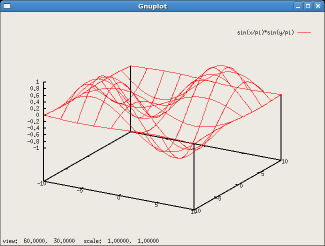
gnuplot> show view

        view is 60 rot_x, 30 rot_z, 1 scale, 1 scale_z
|
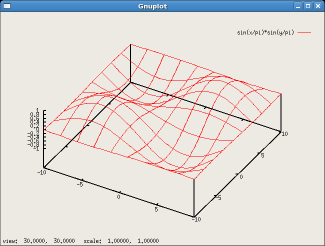
gnuplot> set view 30,30 gnuplot> replot |
| (3D)3次元グラフに色を付ける |
gnuplot> splot sin(x/pi)*sin(y/pi)
                         ↑ここで表示されるのが色の付いていない状態
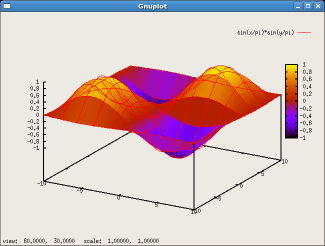
gnuplot> set pm3d
gnuplot> replot
|
|
set pm3d at s (set pm3dと同じ) |
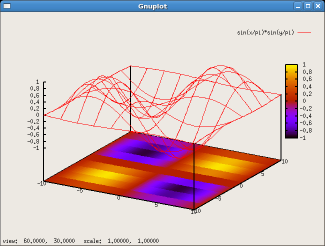
set pm3d at b |

|
|
|
set pm3d at t |
set pm3d at sb |
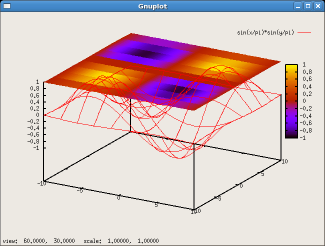
|
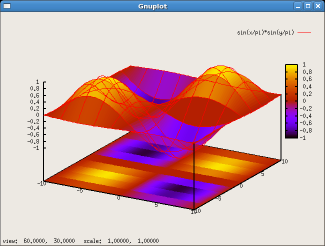
|
gnuplot> splot sin(x/pi)*sin(y/pi) gnuplot> set pm3d gnuplot> set palette model RGB gnuplot> set palette defined (0 "black", 1 "blue", 2 "red", 3 "yellow", 4 "white", 5 "blue", 6 "yellow") gnuplot> replot |
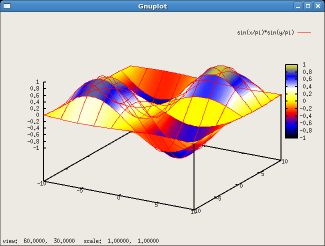
gnuplot> set cbrange [-0.2:0.8] gnuplot> replot |
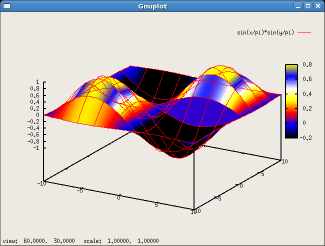
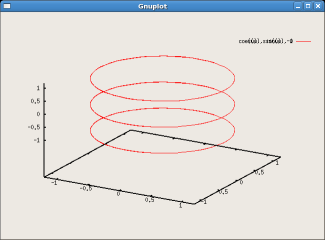
| (3D)3次元グラフで円を描く |
gnuplot> set parametric

        dummy variable is t for curves, u/v for surfaces
gnuplot> set multiplot           ←複数の円(もしくはその他の式)を書きたい場合
multiplot> set xrange [-1.2:1.2]
multiplot> set yrange [-1.2:1.2]
multiplot> set zrange [-1.2:1.2]
multiplot> splot cos(u) , sin(u) , -1    z軸座標=-1
multiplot> splot cos(u) , sin(u) , 0     z軸座標= 0
multiplot> splot cos(u) , sin(u) , 1     z軸座標= 1
|
| TopPage > gnuplot関係 > gnuplot関係[03] |