
|
| since 2007.10.24 |
| last update 2011.02.06 |
|
|
|
|
| TopPage > gnuplot関係 > gnuplot関係[04] |
| (3D)データファイルを読み込んで3次元グラフをプロットする |
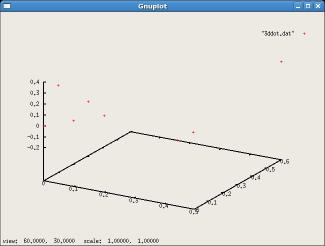
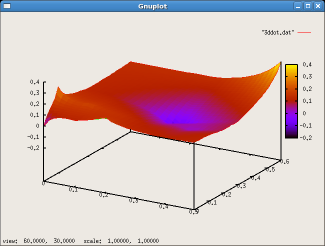
# TEST 3D PLOT file name:3ddot.dat # x y z 0.0 0.0 0.0 0.0 0.1 0.3 0.1 0.0 0.1 0.1 0.1 0.2 0.2 0.0 0.2 0.4 0.2 0.0 0.5 0.6 0.4 0.3 0.3 -0.2 |
gnuplot> splot "3ddot.dat" |
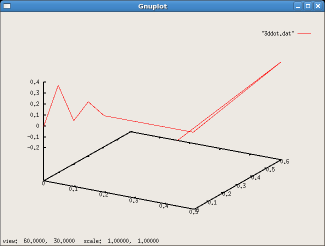
gnuplot> splot "3ddot.dat" with line gnuplot> replot |
gnuplot> set dgrid3d gnuplot> replot |

gnuplot> set dgrid3d 50, 30 gnuplot> replot |
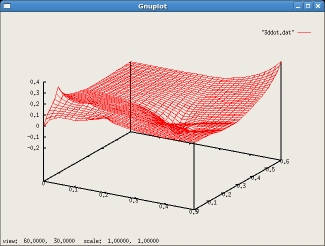
gnuplot> set hidden3d gnuplot> replot |
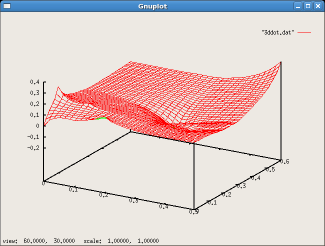
gnuplot> set pm3d gnuplot> replot |
| 軸の目盛りの表記数値の書式 |
| 書式 | 内容 | sample |
| %f | 浮動少数点表示 | "%f" , "%3.2f" , "%+4.1f" , "%.2f" |
| %e | %E | 指数表示 | |
| %g | %G | 浮動小数点表示と指数表示を自動的に簡略表示する(default) | |
| %x | %X | 16進数表示 | |
| %o | 8進数表示 | |
| %m | 月表示 1〜12 | |
| %M | 秒表示 0〜60 | |
| %t | 基数が10の仮数表示 | |
| %T | 基数が10の指数表示 | |
| %l (エル) | 現在の対数の底を基数とした仮数表示 | |
| %L | 現在の対数の底を基数とした指数表示 | |
| %s | 現在の対数の底を基数とした値の3倍の仮数表示 | |
| %S | 現在の対数の底を基数とした値の3倍の指数表示 | |
| %c | 単位付き表示。m(ミリ)/k/M/Gなどが使用可能 | "%cm" , "%s %cg" |
| %P | πの倍数表示 | "%.0P pi" |
|
date_specifiers |
日付、時間関係の書式 |
|
specifiers |
数値関係の書式 |
|
time_specifiers |
日付、時間関係の書式(date_specifiersと同じ?) |
| 式のタイトル表示 |
|
gnuplot> set key top |
グラフ内側の上側。左右の位置は、left rightで決める |
|
gnuplot> set key bottom |
グラフ内側の下側。左右の位置は、left rightで決める |
|
gnuplot> set key left |
グラフ内側の左側。上下の位置は、top,bottom,outside,bellowで決める |
|
gnuplot> set key right |
グラフ内側の右側。上下の位置は、top,bottom,outside,bellowで決める |
|
gnuplot> set key outside |
グラフ外側の上側。左右の位置は、left rightで決める |
|
gnuplot> set key bellow |
グラフ外側の下側。左右の位置は、left rightで決める |
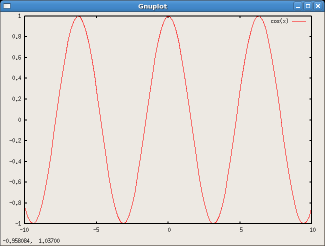
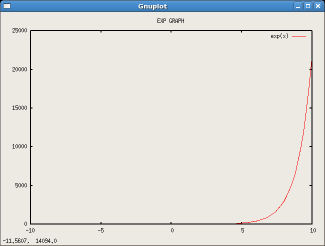
| グラフにタイトルを付ける |
gnuplot> set title "EXP GRAPH" gnuplot> plot exp(x) |
|
|
gnuplot |
|
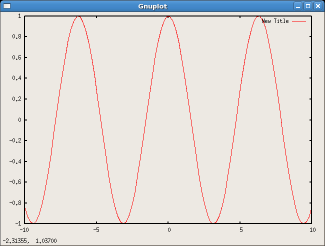
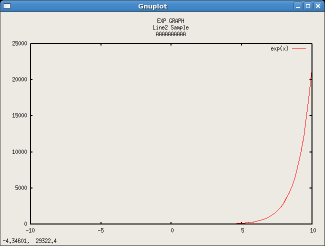
gnuplot> set title "EXP GRAPH\nLine2 Sample\nAAAAAAAAAA" gnuplot> plot exp(x) |
|
|
gnuplot |
|
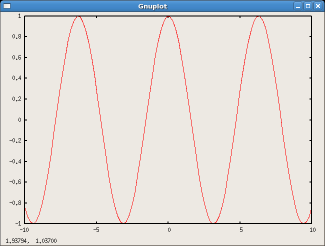
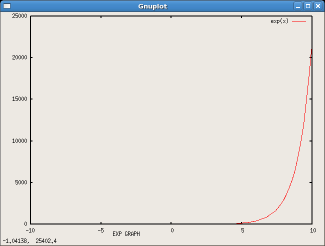
gnuplot> set title "EXP GRAPH" -15,-36 gnuplot> plot exp(x) |
gnuplot> set title gnuplot> replot |
| TopPage > gnuplot関係 > gnuplot関係[04] |