|
| since 2007.10.24 |
| last update 2011.02.06 |
|
|
| TopPage > gnuplot関係 > gnuplot関係[05] |
| 軸にラベルを付ける |
gnuplot> plot atan(x) gnuplot> set ylabel "Y label point" gnuplot> replot |
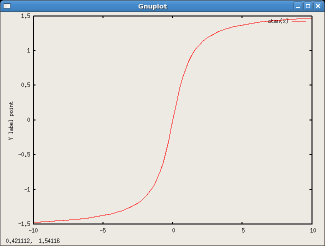
|
|
gnuplot |
|
gnuplot> plot atan(x) gnuplot> set ylabel "Y label point" 1,30 gnuplot> replot |
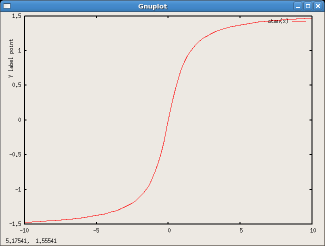
| ラベル(文字列)を入れる |
| first | 表示しているグラフのx-y座標系を基準とする |
| second | 表示しているグラフのx2-y2座標系を基準とする |
| graph | グラフの左下を0,0、右上を1,1としたときの座標系 |
| screen | 描画画面のの左下を0,0、右上を1,1としたときの座標系 |
| left | 文字列の表示開始点が、文字列の左側 |
| center | 文字列の表示開始点が、文字列の中央 |
| right | 文字列の表示開始点が、文字列の右側 |
| 矢印、直線をプロットする |
| 2次元グラフの矢印 | 3次元グラフの矢印 |
|
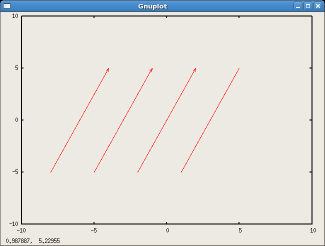
set arrow 1 from -8,-5 to -4,5 set arrow 2 from -5,-5 to -1,5 set arrow 3 from -2,-5 to 2,5 set arrow 4 from 1,-5 to 5,5 nohead |
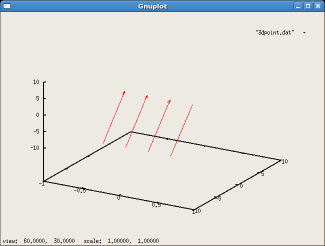
set arrow 1 from -0.5,-5,-10 to -0.5,0,2 set arrow 2 from -0.2,-5,-10 to -0.2,0,2 set arrow 3 from 0.1,-5,-10 to 0.1,0,2 set arrow 4 from 0.4,-5,-10 to 0.4,0,2 nohead |
|
|
| 線幅,線の色を選んでプロットする |
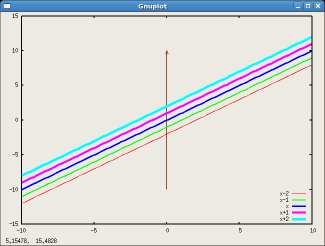
gnuplot> plot \ > x-2 lw 1 lt 1,\ > x-1 lw 2lt 2,\ > x lw 3 lt 3,\ > x+1 lw 4 lt 4,\ > x+2 lw 5 lt 5 gnuplot> set arrow 1 from 0,-10 to 0,10 lw 2 lt 6 gnuplot> replot |
|
| 軸、グラフの枠のカスタマイズ |
| 枠を非表示 | 枠を表示 |
|
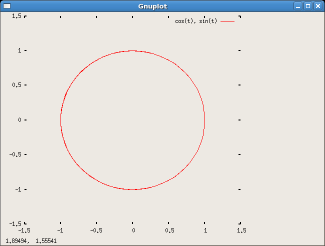
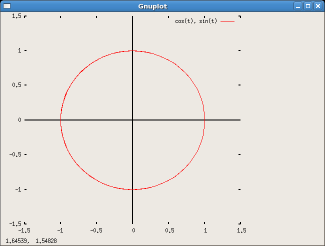
set parametric plot cos(t),sin(t) set size square set xrange [-1.5:1.5] set yrange [-1.5:1.5] unset border |
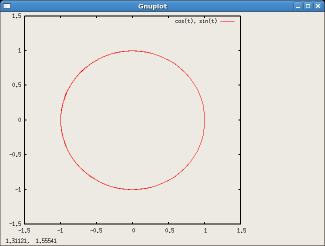
set border |
|
|
|
|
gnuplot |
|
| 0上のx軸を表示 | 0上のx軸を非表示 |
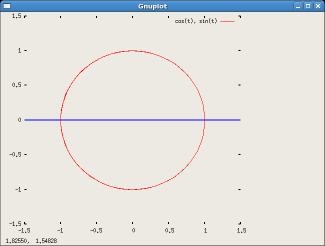
| set xzeroaxis lt 3 lw 2 | unset xzeroaxis |
|

|
| 0上のxy軸を表示 | 0上のxy軸を非表示 |
| set zeroaxis lt -1 | unset zeroaxis |
|

|
| TopPage > gnuplot関係 > gnuplot関係[05] |