|
| since 2007.10.24 |
| last update 2011.02.13 |
|
|
| TopPage > gnuplot関係 > gnuplot関係[06] |
| グラフのサイズ、余白を変える |
| Instruction | discription | exsample |
| set size scale | グラフのサイズを倍率で変更 |
set size 0.5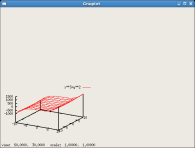
|
| set size x_scale, y_scale | グラフのサイズを縦横ごとに倍率で変更 |
set size 0.5,1.2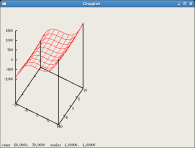
|
| set size ratio num | グラフのサイズを(縦÷横)の比で指定 |
set size ratio 2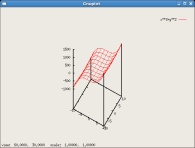
|
|
set size noratio |
ratioを解除する |
set size noratio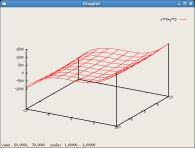
|
| set size square | 正方形のサイズで表示する。 |
set size square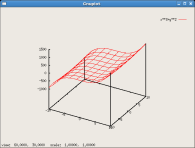
|
| set size nosquare | 正方形のサイズ表示を解除する |
set size nosquare
|
| set size | サイズ設定を標準に戻す |
set size
|
|
|
gnuplot |
|
| Instruction | discription | exsample |
| set tmargin width |
上マージンを調整する デフォルトに戻すには、 set tmargin replot |
set tmargin 12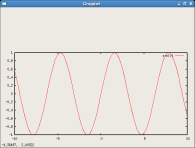
|
| set bmargin width |
下マージンを調整する デフォルトに戻すには、 set bmargin replot |
set bmargin 12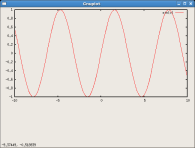
|
| set lmargin width |
左マージンを調整する デフォルトに戻すには、 set lmargin replot |
set lmargin 12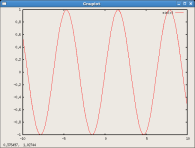
|
| set rmargin width |
右マージンを調整する デフォルトに戻すには、 set rmargin replot |
set lmargin 12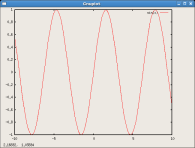
|
|
|
gnuplot |
|
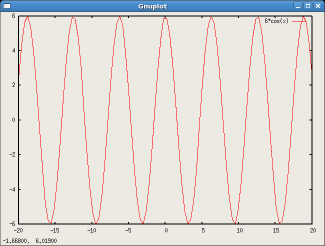
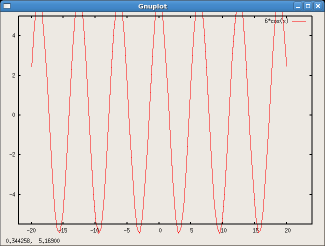
gnuplot> plot [-20:20] [-6:6] 6*cos(x) |
|
|
gnuplot |
|
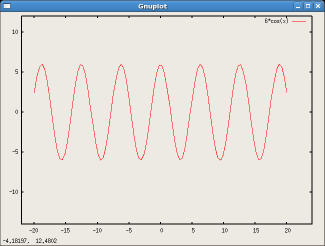
gnuplot> set offsets 2,4,6,8 gnuplot> replot |
|
|
gnuplot |
|
gnuplot> set offsets 2,4,-1,-0.5 gnuplot> replot |
| 画像ファイルへの出力 |
|
aed512 aed767 aifm bitgraph cgm corel dumb dxf eepic emf emtex epslatex epson_180dpi epson_60dpi epson_lx800 fig gpic hp2623A hp2648 hp500c hpdj |
hpgl hpljii hppj imagen kc_tek40xx km_tek40xx latex mf mif mp nec_cp6 okidata pbm pcl5 png postscript pslatex pstex pstricks qms regis selanar |
starc svg table tandy_60dpi tek40xx tek410x texdraw tgif tkcanvas tpic unknown vttek x11 X11 xlib |
gnuplot> plot x**2+x**3 数式をぷろっとさせる gnuplot> set terminal png png形式で出力するよう設定 Terminal type set to 'png' Options are 'small color picsize 640 480 ' defaultは、640x480のサイズ set terminal png size x,yで、サイズ変更可能 gnuplot> set output "test.png" 出力ファイル名を指定 gnuplot> replot 再出力を指定することでpng形式のファイルができる gnuplot> set terminal x11 terminalをx11に戻す Terminal type set to 'x11' Options are '0' gnuplot> show terminal ternimalがx11に戻ったか確認 terminal type is x11 0 |

| LATEXへの出力 |
gnuplot> plot sin(x) title "" gnuplot> set arrow 1 from pi/4+pi/8,sin(pi/4)-sin(pi/8) \ > to pi/4,sin(pi/4) lt 3 |
gnuplot> set label 1 "$$y=\\sin\\theta$$" \ > at pi/2,sin(pi/4)-sin(pi/7) center gnuplot> replot |
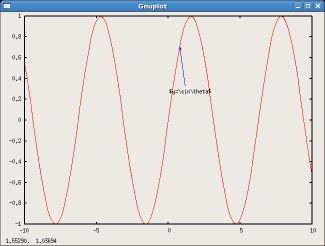
gnuplot> set terminal latex Terminal type set to 'latex' Options are '(document specific font)' gnuplot> set output "sin_figure.tex" gnuplot> replot |
\documentclass{article}
\begin{document}
  \begin{figure}
  \begin{center}
    \input{sin_figure.tex}
  \end{center}
  \end{figure}
\end{document}
|
[host]$ latex sin_figure_main.tex |
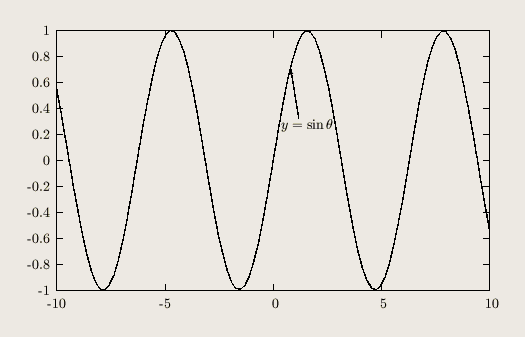
[host]$ convert sin_figure_main.dvi -crop 380x240+130+270 \ >-quality 100 sin_figure_main00.png |

| スクリプトファイルの使用 |
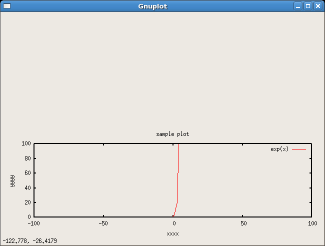
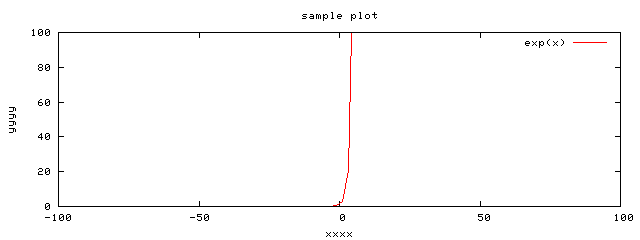
# script file sample #はコメント行 # file name : sample.gp set xrange [-100:100] set yrange [0:100] set title "sample plot" set xlabel "xxxx" ; set ylabel "yyyy" ;はセパレータ set size 1.0 ,\ \は改行を無視 0.5 plot exp(x) set terminal png set output "sample_gph.png" replot set terminal x11 |
gnuplot> call "sample.gp" |
gnuplot> load "sample.gp" |
$gnuplot sample.gp |
|
gnuplotのx11グラフ表示 (コマンドライン内での実行の場合) |
|
|
出力ファイル (sample_gph.png) |
|
| TopPage > gnuplot関係 > gnuplot関係[06] |