|
| since 2007.10.24 |
| last update 2011.01.08 |
|
|
| TopPage > gnuplot関係 > gnuplot関係[07] |
| 定数、媒介変数を使用したプロット |
gnuplot> Abc = 3 |
gnuplot> aBC = 3.0 |
gnuplot> show variables

        Variables:
        pi = 3.14159265358979   ←初期状態でπはpiで設定されている
        Abc = 3
        aBC = 3.0
|
gnuplot> set parametric

        dummy variable is t for curves, u/v for surfaces
|
gnuplot> set parametric

        dummy variable is t for curves, u/v for surfaces

gnuplot> a=3.0
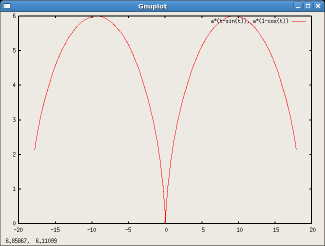
gnuplot> plot a*(t-sin(t)),a*(1-cos(t))
|
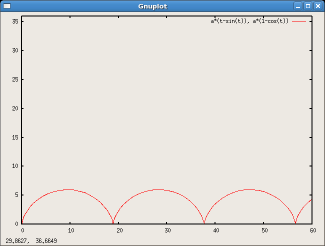
gnuplot> set xrange [0:60] gnuplot> set yrange [0:36] gnuplot> set trange [0:22] gnuplot> replot |
| 対数グラフ |
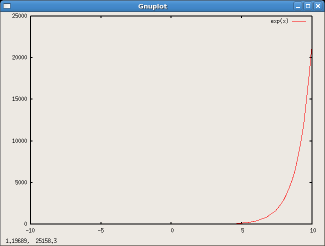
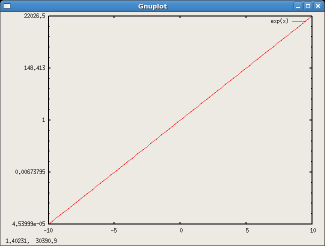
| 元の表示 | y軸をLogにした表示 |
| plot exp(x) |
set logscale y exp(1) plot exp(x) |
|
|
|
|
gnuplot |
|
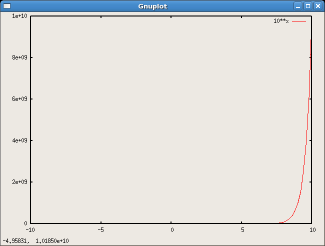
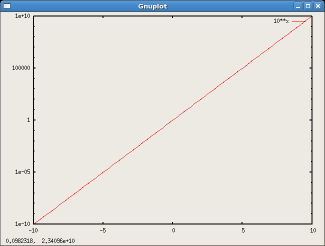
| 元の表示 | y軸をLog10にした表示 |
| plot 10**x |
set logscale y 10 plot 10**x |
|
|
| 棒グラフ |
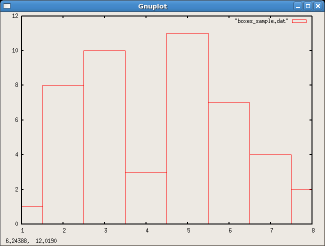
# boxes_sample.dat # x y 1 1 2 8 3 10 4 3 5 11 6 7 7 4 8 2 |
gnuplot> plot "boxes_sample.dat" with boxes |
|
|
gnuplot |
|
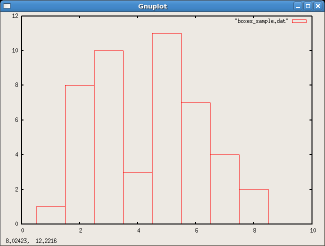
gnuplot> plot [0:10] "boxes_sample.dat" with boxes |
|
|
gnuplot |
|
gnuplot> plot [0:10] "boxes_sample.dat" with boxes lt 3 ←境界を青色にする |
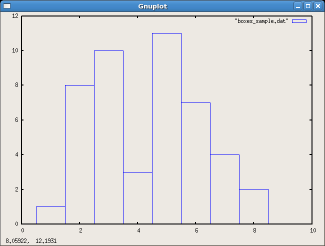
|
|
gnuplot |
|
gnuplot> set style fill border 1 ←境界を赤にして元の境界色で塗りつぶす gnuplot> set style fill solid 0.5 ←塗りつぶす密度を指定。0.0〜1.0 gnuplot> replot |
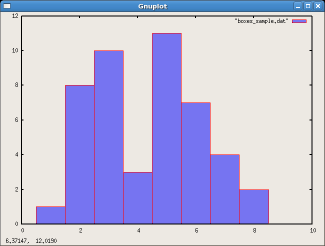
gnuplot> set style fill empty ←塗りつぶしをやめる gnuplot> replot |

|
|
gnuplot |
|
gnuplot> set boxwidth 0.8 ←棒の幅を指定する gnuplot> replot |
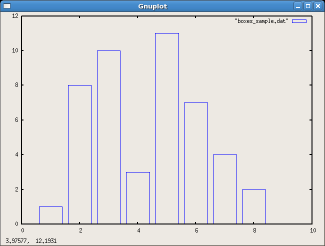
|
|
gnuplot |
|
gnuplot> set boxwidth gnuplot> replot |
| 指定領域を塗りつぶす方法 |
gnuplot> plot [-10:5] cos(x) with filledcurves lt 3 |
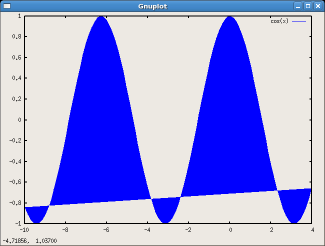
|
|
gnuplot |
|
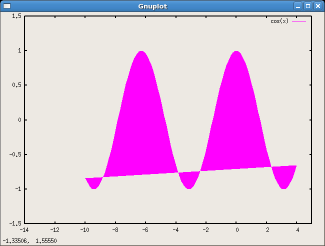
gnuplot> set offset 4,1,0.2,0.5 gnuplot> plot [-10:5] cos(x) with filledcurves lt 4 |
|
|
gnuplot |
|
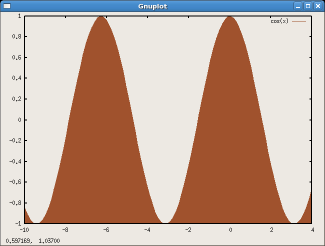
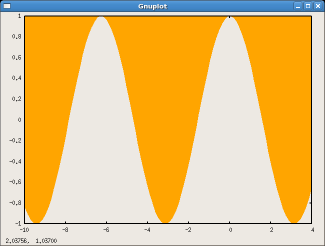
| plot [-10:4] cos(x) with filledcurves x1 lt 6 | plot [-10:4] cos(x) with filledcurves x2 lt 7 | |
|
|
|
|
gnuplot |
|
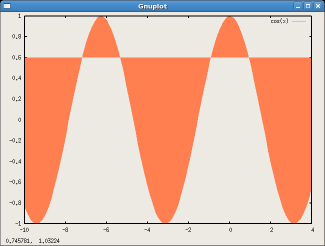
| plot [-10:4] cos(x) with filledcurves y{1|2}=0.6 lt 8 |
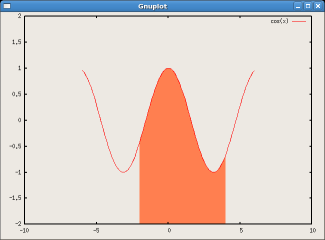
set multiplot set offset 8,6,1,1 plot [-2:4] cos(x) with filledcurves x1 lt 16 unset border set offset 4,4,1,1 plot [-6:6] cos(x) |
|
|
| TopPage > gnuplot関係 > gnuplot関係[07] |